dataMinds News Round up –
November 2022
Microsoft Ignite
Microsoft Ignite is the Microsoft’s largest annual event for technology professionals and developers worldwide. The new online format of recent editions, participation has risen to over 250,000 visitors.
Microsoft Ignite is a showcase of the best of what’s next for Microsoft and its partners, technical decision-makers and information technology implementers. The products and updates unveiled during Microsoft Ignite are designed to help customers, partners and developers get the full value of Microsoft’s technologies.
Azure
In for a Synapse Espresso? In this episode, Stijn Wynants & Liliam Cristiman Leme elaborate about dedicated SQL pool and the distributed SQL database capability inside Azure Synapse Analytics.
Let’s get coffee!
Dying to know what’s new in store for Azure Synapse Analytics? This month, Ryan Majidimehr focuses on features released at Microsoft Ignite 2022, breaking from the tradition editions. In this episode, Ryan highlights some of his favorite features and will walk you through a demo for each feature.
You’ve probably heard the term lakehouse with various services like Azure Synapse Analytics. But what actually is a lakehouse? And why is it different from a data warehouse? The infamous guys in a cube do the explanation.
SQL
SQL Server 2022 is on its way and there are a lot of new features that could be of interest. Beginning with SQL Server 2012, Microsoft has launched a new release of SQL Server every two years at most. This puts IT professionals in a situation where we must decide if updating to the latest version is worth the time and costs. To help with this decision, Daniel Farina provides a list of key features (by category) that are new or have been enhanced in the latest version, SQL Server 2022.
Ever struggled with exporting a partial or entire database, whether it’s an Oracle or SQL database? Pablo Echeverria got you covered with a walkthrough!
Power BI
Did you ever watch the Netflix series The Queen’s Gambit, in which the story follows the life of Beth Harmon, a fictional chess prodigy on her rise to the top of the chess world? This series, released in October 2020, didn’t only triple the revenue of chess set vendors during the first months post release but did also spark the enthusiasm of millions of new and returning chess players.
In this article, after two years of chess fun, Lou Segers analyzes his chess behaviour using Power BI!
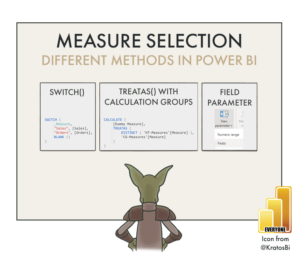
Flexibility without complexity is key in well-designed, interactive reports. The report should be able to answer a wide berth of business questions within its design scope. To do this, users must be able to use interactions to zoom, filter and get details-on-demand. This is true not only for categorical fields on axes, slicers or filters, but also quantitative fields — measures.
Kurt Bühler‘s data goblins zoom in on all methods a user or visual chooses to display one ore more measures in a Power BI report.


