dataMinds News Round up –
October 2022
Azure
In for a Synapse Espresso? In this episode, Stijn Wynants & Filip Popovic walk us through the basics of Delta Lake, such as what Delta Lake format is and how it enables us to update our data in the Lake. They will also show us how serverless SQL pool enables us to query data in Delta Lake format.
Let’s get coffee!
Dying to know what’s new in store for Azure Synapse Analytics? This month, Ryan Majidimehr got you covered on topics like MERGE for dedicated SQL pools, Auto-statistics for CSV datasets in serverless SQL and the new Livy errors codes for Apache Spark in Azure Synapse Analytics. Additional general updates and new features in Synapse Data Explorer and Data Integration are also mentioned in this edition.
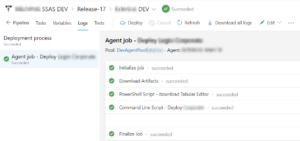
Ever ran into an issue you couldn’t manage SSAS access into the SSAS Tabular Model anymore? Since deploying a Tabular Model using Visual Studio is also overwriting members & roles, a valid alternative to execute deployments is required. Learn how Olivier Van Steenlandt trespassed this challenge by deploying the model and roles & members seperately using Tabular Editor.
SQL
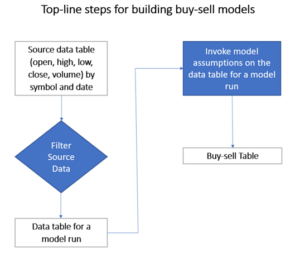
Seeking to grow your skills in investment analytics using SQL Server? In this article, Rick Dobson explains how to build a buy-sell model which can accept open and close prices for a financial security over successive trading days from a start date through an end date as input. The model searches for a succession of buy dates, each followed by a matching sell date. The main objective of the model is to discover buy-sell date pairs with higher sell prices than matching buy prices.
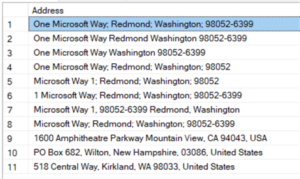
Data quality is a topic that concerns most businesses, especially when it comes to verifying data. When you have user input, it’s important to check that the entered data is correct. Studies show millions of dollars are spent fixing data quality issues. Not trying to fix them can cost businesses even more.
How can we quickly create an effective data quality solution in an ETL tool like SSIS without spending too much time and money on development? Koen Verbeeck to the rescue!
Power BI
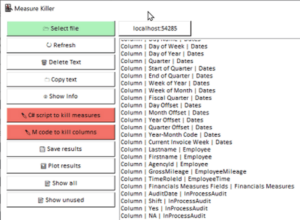
Matt Allington zooms in on Gregor Brunner‘s recently released Power BI external tool: the Measure Killer. This tool’s main feature is detecting & deleting unused columns and or measures.
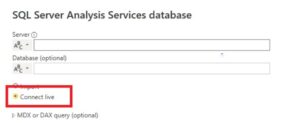
It’s very easy to get confused between a Live connections and DirectQuery mode in Power BI: many frequently get them mixed up, partly because they are similar concepts, partly because other BI tools use the term “live connection” to refer to what Power BI calls DirectQuery mode. In this post, Chris Webb explains the differences between these two terms.
Aggregation is a game-changer feature in the performance and speed of Power BI Solutions when the data source table is huge. With the help of aggregations, you can have layers of pre-calculations stored in memory and ready to respond to queries from the user instantly. The DirectQuery data source will be used only for most atomic transaction queries. Reza Rad walks the talk
The last decade has seen an explosion in data visualization. From business reporting to journalism, scientific literature, fitness and video games… table-based reporting is giving way to more dynamic, graphical displays of information. While tables work fine for some use-cases, visualizations generally allow a reader to more easily/effectively find insights in data, helping them understand it, interpret it and eventually act on it.
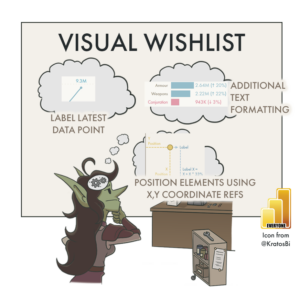
While Power BI is much more than only a reporting / data visualization tool, it is enabling more people to quickly and easily visualize their data without complex code. Kurt Bühler‘s data goblins are getting the job done for a set of predefined business questions, in which they elaborate on several examples how Power BI can take more information-dense tables (before) and transform them to interactive visuals (after).
Non-Technical
After working in tech for the last 25 years, Matthew Roche elaborates on his unplanned career and some of the lessons he has learned along the way.


